Do Better, New York Times
The newest NYT/Siena “battleground poll” is full of biases and absurd results. Buckle up.
The New York Times is out with its Battleground States Poll, so time for everyone to panic. But not me! I’m here to make sure everyone takes a deep breath and puts out any fires they may have set to their hair.
And fires were set, indeed. In fairness, if you were to view just the headlines and breathless cable news coverage of the poll, you might just have an anxiety attack. According to the Times, Trump is leading Biden in 5 out of 6 battleground states—and there goes the election, our democracy and the world!
One common reaction among readers is to sigh and simply say, “Ignore the polls.” While this is understandable, given how wrong they usually are and how much stress they inevitably cause, I want to push back on this approach.
I prefer instead to question the polls and their methodologies and call them out on why they are non-predictive and how they have been misused to create electoral agita. In doing so, I hope to arm readers with actual arguments and data that they can absorb and perhaps even transmit to others whose hair may be on fire. Telling the fire-setters to ignore the polls, when none of the media ever does, is unlikely to prove effective. Explaining, on the other hand, that the poll they may be citing is an outlier, and not to be taken at face value for the following reasons, is a far more informed and productive path, in my view.
Let me say this plainly: The Times poll is intentionally Trump- and conservative-leaning, both in how it was structured and how it was promoted. There may be fine reasons for this, but they are not discussed anywhere. And its data contains some eyebrow raising anomalies that it either glosses over or ignores completely.
With all that said, let’s get into it a bit.
Before we do, take a moment to consider an upgrade if you haven’t become a paid supporter yet. This newsletter strives to bring you information you won’t read elsewhere, including my take down of the NYT/Siena poll. Your support makes this possible. And if you’re already a paying member, thank you!
The spin
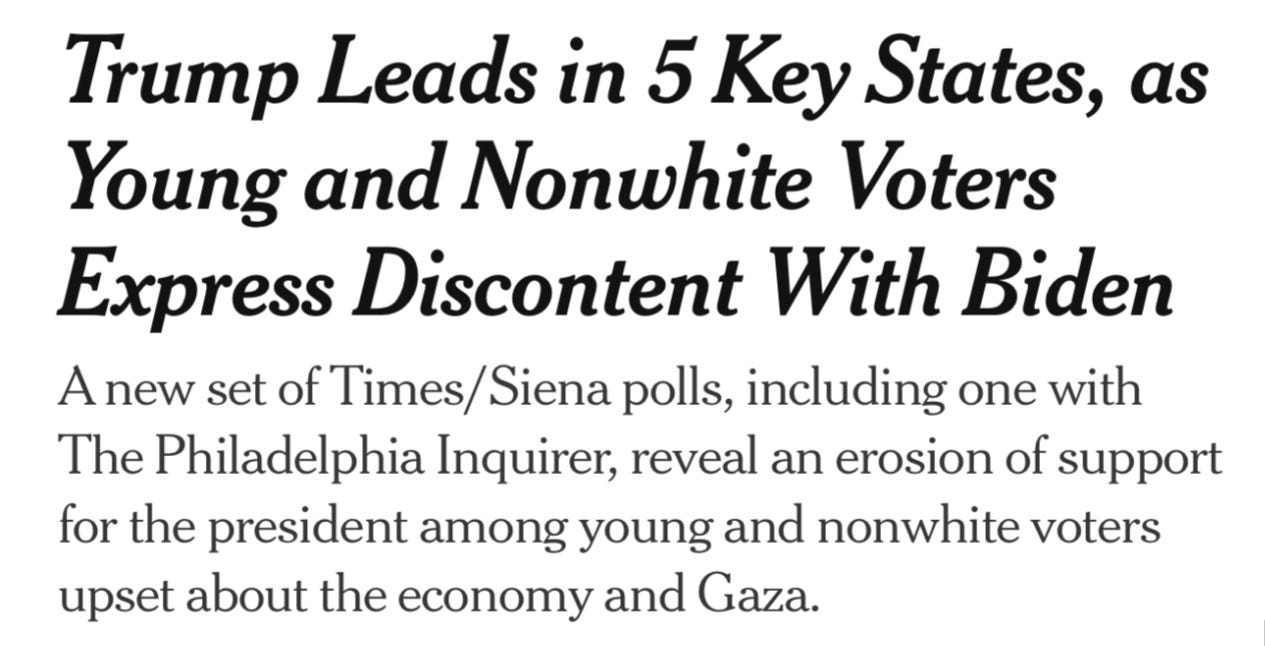
Polls matter most for how the press runs with the data and creates popular narrative. This is an unfortunate reality, because everyone, including the media, should know by now that the polls are not predictive of actual results. And yet, the NYT headline still read as Very Bad News for Biden:
What this headline didn’t mention is that the same poll looked at both registered voters and likely voters, but the headline ran with the numbers out of its registered voters sample.
This is a curious framing. Likely voter polls are far more predictive and useful than registered voter polls. The New York Times surely knows this. And Biden has been leading or tied among likely voters in other polls. In fact, the more likely voters are to vote, the more likely they are Biden voters. This in part explains why the midterms and special elections have been so strong for the Democrats: Those produce turnout among the most motivated, consistent voters.
So what happens to the NYT’s poll numbers when you look at just likely voters? As Simon Rosenberg points out, the picture is really different. Here’s the Biden-Trump match-up by likely voters polled by the Times in the three critical battlegrounds that decided the 2016 and the 2020 elections:
MI 47-46
PA 45-48
WI 46-47
These numbers are all well within the margin of error. In other words, that headline could have read, “Race Essentially Tied in the Electoral College.” But that wasn’t their editorial choice.
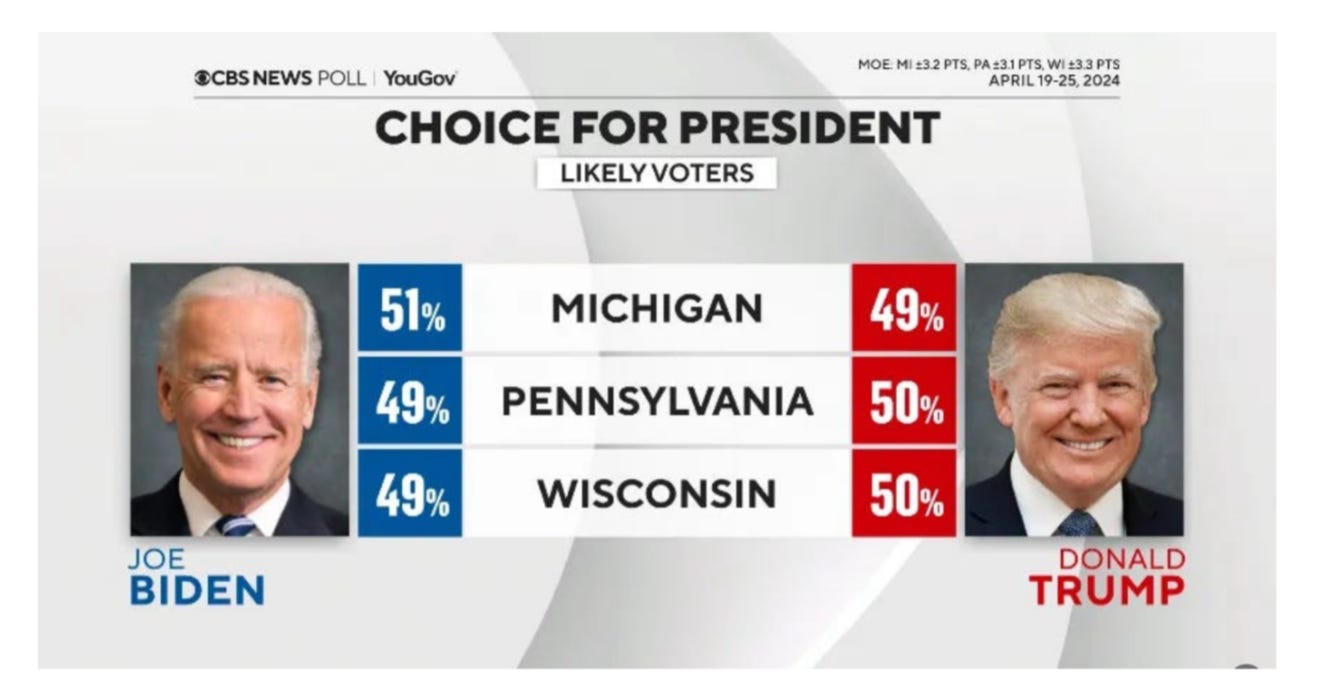
By the way, the likely voter results more or less match other likely voter polls conducted by major outfits. For example, here’s the CBS / YouGov poll from mid- to late April, looking at the same states:
As this poll and the Times poll suggest, the race among likely voters is essentially tied in the states that would return Biden to the White House. Bottom line? This is going to be a hard fought race, and it will feel close. But to claim Trump is leading in five states is, well, rather misleading.
Nor is it correct, even within the Times’s own data, that “Gaza” is what young voters are upset about, as the subheader ominously warns. In fact, that issue only polled around 10 percent among young voters for top issues. The choice to highlight it was again an editorial one.
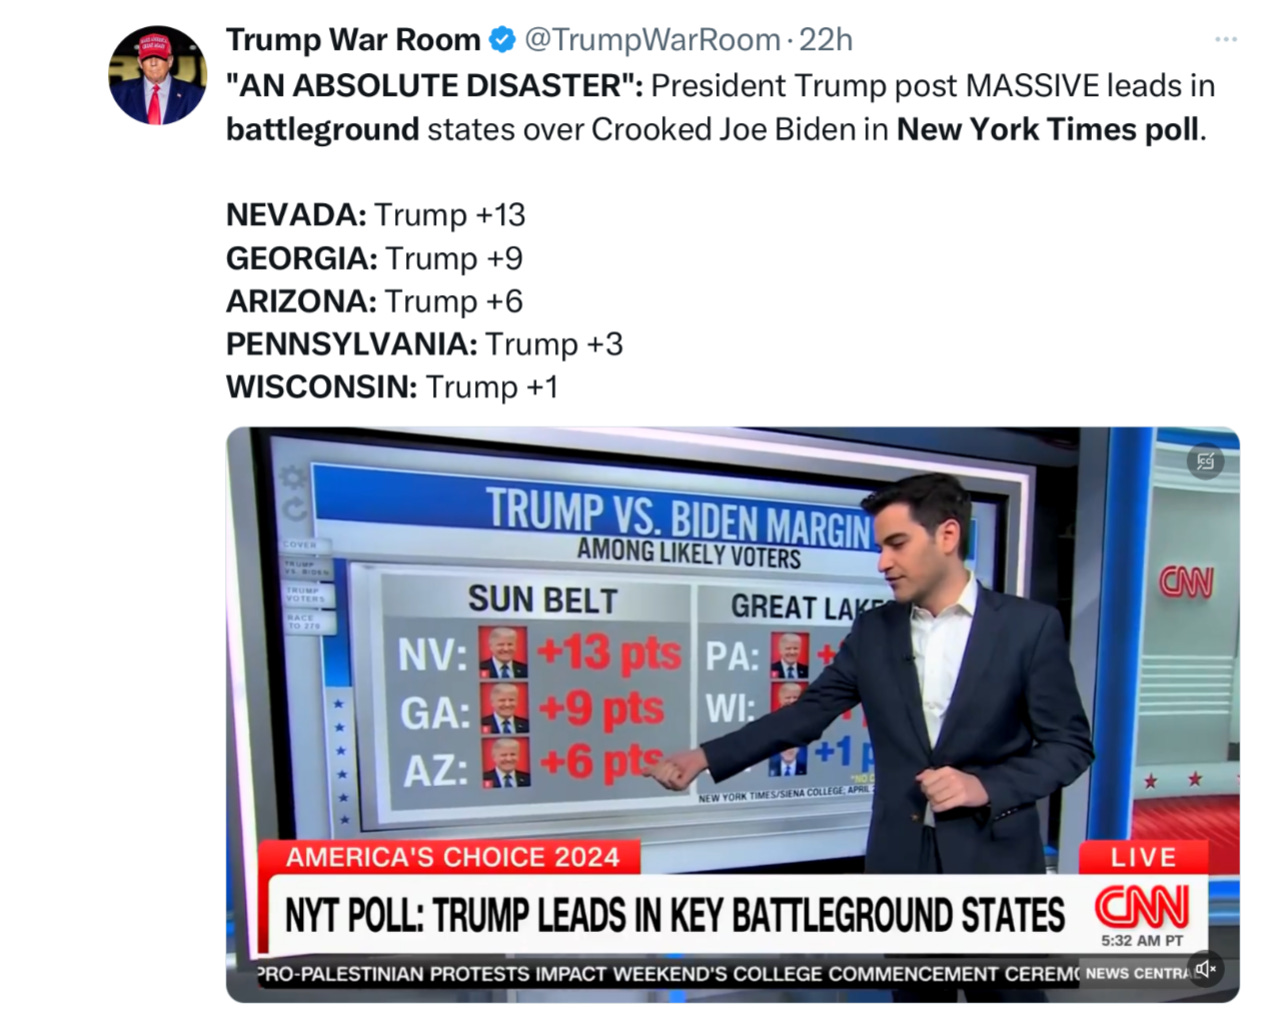
What happens when you put out headlines like this? Other media trolling for eyeballs and anxiety run with it, often irresponsibly. Shortly after the poll’s release, CNN was out with this segment, calling the poll an “absolute disaster” for Biden, something gleefully picked up by the Trump Campaign:
Again, they’re running only with registered voter, not likely voter, numbers. And for reasons I’ll get into below, these figures are all quite questionable.
The frame game
Most people look at a poll’s top line numbers but never get into how the sausage got made. And look, I will admit, NYT/Siena is generally considered a top tier pollster, and I don’t believe they are intentionally trying to skew the results against Biden. But it doesn’t mean they don’t get it wrong, sometimes quite seriously. And it doesn’t mean their methodologies shouldn’t be at least highlighted so people can draw better conclusions.
Bear with me while I invite you to blink a few times at the numbers underlying the poll. You don’t need to fully understand everything, just that there’s a lot of framing and weighting going on here, and that could impact why the poll looks so bad for Biden.
No one reading about the poll, even in the Times’s own write-up of it, would realize, for example, that it had intentionally oversampled Republican voters, and by a wide margin:
COMBINED ANSWERS: Party identification and leaners
The Democratic Party: 45%
The Republican Party: 49%
Don’t know/Refused: 7%
This means that there were more GOP voters in the poll than exist out there in the real world. So to make up for this, they have to start adding all kinds of mathematical “weights” to try and account for the fact that there are just so many more Republicans in their data.
I’m not saying the Times shouldn’t overweight Republicans. Perhaps they decided internally that they needed to, given that many GOP voters were missed in the last elections. But it’s become a question of transparency and honesty to its readers. As the Northwest Progressive Institute stated in its critique of the recent poll,
The word “oversampled” doesn’t appear in either Shane Goldmacher’s writeup of the poll results or Nate Cohn’s writeup. However, if you open the actual dataset, look through it, and read the endnotes, a key fact should become immediately apparent: Republican voters were oversampled in these polls.
It’s irresponsible of the NYT to not state this upfront in all of its coverage. This is an important design choice that they made, and it ought to be explained.
There’s another problem with the sample set: It’s heavily biased toward conservatives. In fact, a full 80 percent of its respondents described themselves as something other than liberal, with nearly twice as many conservatives answering:
ANSWERS [ALL STATES]:
Very liberal: 10%
Somewhat liberal: 10%
Moderate: 39%
Somewhat conservative: 19%
Very conservative: 17%
Don’t know/Refused: 5%
Was this oversample of conservatives on purpose? Any mention of why there’s a conservative lean by the Times? Nope.
The notes also explain that they conducted interviews in both Spanish and English, which is an improvement over their last poll, where pretty much only English-speaking Latino households were included. That poll had resulted in an absurd result, with more Latinos polled actually choosing Trump over Biden, which is highly statistically improbable in 2024.
This time, they did make more of an effort to conduct interviews in Spanish, perhaps in response to criticism, but the numbers still get buried a bit unless you dig. The Times explains toward the end of its data that “12 percent of interviews among self-reported Hispanics were conducted in Spanish, including 19 percent in Nevada and 13 percent in Arizona.”
That’s certainly better than the 3 percent it interviewed in Spanish in its poll in March. And this time it resulted in a 50/42 split for Biden/Trump within the Hispanic respondents, again an improvement for Biden. But these figures in the teens for Spanish language interviews are still not reflective of the make-up of the community, where some 34 percent of Latino households are Spanish-dominant. That number may be far higher in the sunbelt swing states—Arizona and Nevada—where the Times claims Trump is leading by a large margin. As I wrote about earlier, Univision found in its polling that Spanish-speaking Latinos are far more likely to vote Democratic (62-26) than English-speaking Latinos (46-43). To conduct only 1-in-5 or 1-in-7 interviews in Spanish is to miss this demographic by a wide amount.
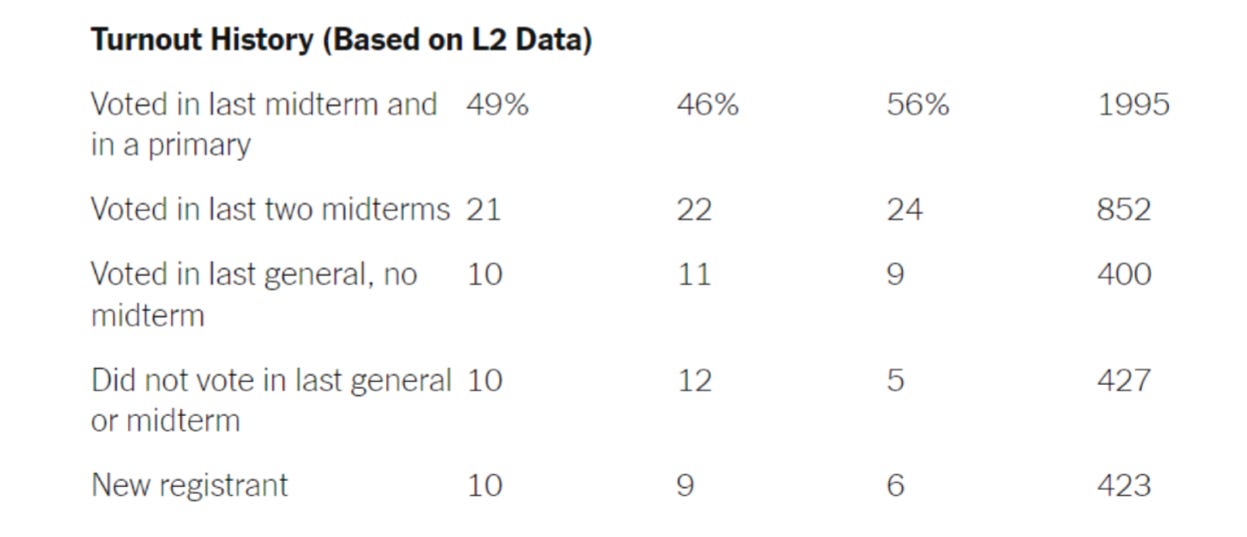
The definition of “likely voter” here got stretched a bit thin for my taste as well. Greg Sargent of the New Republic asked Nate Cohn over Twitter to clarify the definition of “likely voter” in the NYT poll:
Quick Q, am I reading this correctly: In your LV electorate, a total of 20% have either not voted in the last two midterms, have not voted in general or last two midterms, or are newly registered/never voted?
Cohn responded, “You are reading that correctly.”
Well that gets a “wow” from me.
Among just the registered voters sampled in the poll, there are also a lot of reasons to doubt the accuracy of the result. It’s actually a good case study of the perils of looking just at registered voters instead of likely ones.
In Michigan, for example, where likely voters in the NYT poll favored Biden, 20 percent of the sample of registered voters are folks who actually did not vote in 2020. That group highly favors Trump, and it’s one reason the Times has Trump leading among registered voters in the state. It’s very possible these voters were included to try and capture more younger voters, but it also includes very low propensity voters. It’s fair to ask, “If they didn’t vote at all in 2020, in the highest turnout and biggest election of their lifetime to date, why include their opinion in a poll for 2024?”
To sum up, the Times overweighted Republicans, conservatives and English-speaking Latino households in its sample. It then used weights to try and normalize the results, but it didn’t bother to disclose any of this in its reporting. You had to go into the notes of the Cross-tab Reports to find it.
Among “likely voters” it sampled, 10 percent actually did not vote in either the last general election or the last midterm, and 10 percent were new registrants. These are not “likely” voters in my view. And the poll’s reliance on registered voters is not going to be very helpful, when a full 20 percent of them in states like Michigan apparently didn’t even bother to vote the last time around.
Absurdities should lead to more self-reflection and caution
Election observers poring over the details of the polls were quick to point out some rather ridiculous conclusions. I should first note that every poll has some amount of bad data in it, and we shouldn’t ever draw broad conclusions from small sample sets. But when a poll is riddled with data that defies reality and all probability, we need to at least take note.
Take Pennsylvania. The NYT poll has Biden winning Philadelphia by 54-30, which is a big drop from how he did in 2020, when he won 81.4 percent of the vote there. That means either that there is a massive collapse in Black voter support for Biden in just four years, or that the poll is not picking up the right data. And in the suburbs, the NYT poll shows a suburban shift to the right since 2020, despite trending to the left in every election since then, including just a few months ago.
We can also look at Nevada. The NYT poll has Biden actually losing Clark County, a Democratic stronghold, by eight points. As Democratic consultant Tim Hogan noted, “That is not going to happen. Insane that outlier numbers are driving so much coverage.” Reporter Jon Ralston, who crunches Nevada numbers for a living and is my go-to guy on this, remarked that something is amiss in these Nevada numbers. He tweeted,
I hesitate to post more on NYT/Siena poll, but regionals are bizarre:
Trump up 8 in Dem bastion of Clark where Biden beat him by 9 in 2020. 17-pt swing!
In Washoe, where Biden won by 4, Trump is up 14! 18 pts!
There’s somethin’ happenin’ here...
The only poll that counts...
There’s more absurdity to point out when we look at just the youth vote. As pollster John Della Volpe stated,
Worth noting in NYT poll this morning:
Among Registered Voters, Biden trails youth 18-29, 46%-43%
Among Likely young voters, Biden up 53%-46%.
That’s right: The poll actually has Biden losing among young registered voters by three points. This again runs contrary to what has happened in every election in recent history. As Simon Rosenberg helpfully points out,
Let’s compare the NYT results with 18-29 year olds with two other recent large sample national polls, Biden-Trump:
NYT 30%-31% Trump up 1
Harvard/IOP 56%-37% Biden up 19
Pew 59%-38% Biden up 21
That’s a 20+ point difference in result. It doesn’t take much looking at this to call B.S. on the Times. Something went way wrong with its youth vote sample.
This is not to say that the Biden Campaign should ignore some of the inherent warnings in the poll. For example, within the same NYT poll over time, there hasn’t been much movement, at least not yet, toward Biden in the battleground states among the kinds of people interviewed. And it’s clear that, at least under the Times’s skewed methodology, Biden has work to do among minorities and young voters, which the Biden Campaign does not deny.
But we the electorate need to be wise to the weighted tweaks and nonsensical outcomes that the Times poll contains. We need to look at it with an appropriate and healthy amount of skepticism. Nothing in the poll at the end of the day changes the fact that the race is in fact tight and will be decided in the battleground states, just as the last two elections were.
But beyond that, we need to recognize the Times poll for what it is: An annoying headline maker that regrettably forces others, like this author, to have to sigh and methodically walk everyone through it to point out its many problems. I hope after undertaking this review with me, you’ll feel better equipped to deal with that heart-sinking feeling—the one the “paper of record” routinely delivers whenever it releases its newest, flawed poll.
Don’t just ignore it. Understand what’s really going on and the false media narrative it is creating. Educate yourself and others, and then get back to the business of helping Biden beat Trump once again.



Thank you! I took one look at that headline and decided to get rid of my NYTimes subscriptions. I really kept it for the cooking section--and they have cooked their goose with me!
Thank you, Jay! I read the headlines from the NYT and Washington Post every morning and think "well that's depressing". Then I ready the daily email from you and Heather Cox Richardson and feel much better. Thank you for all that you do to keep us informed!